For this project I designed and delivered a Finance Analytics Dashboard giving leadership a consolidated view of unbilled revenue and other receivables across the business. The goal was to transform finance data into a structured executive reporting experience that could highlight exposure, monitor aging patterns and surface concentration risk across divisions, customers, categories, currencies and ledgers — replacing static spreadsheets with an interactive, decision-ready view.
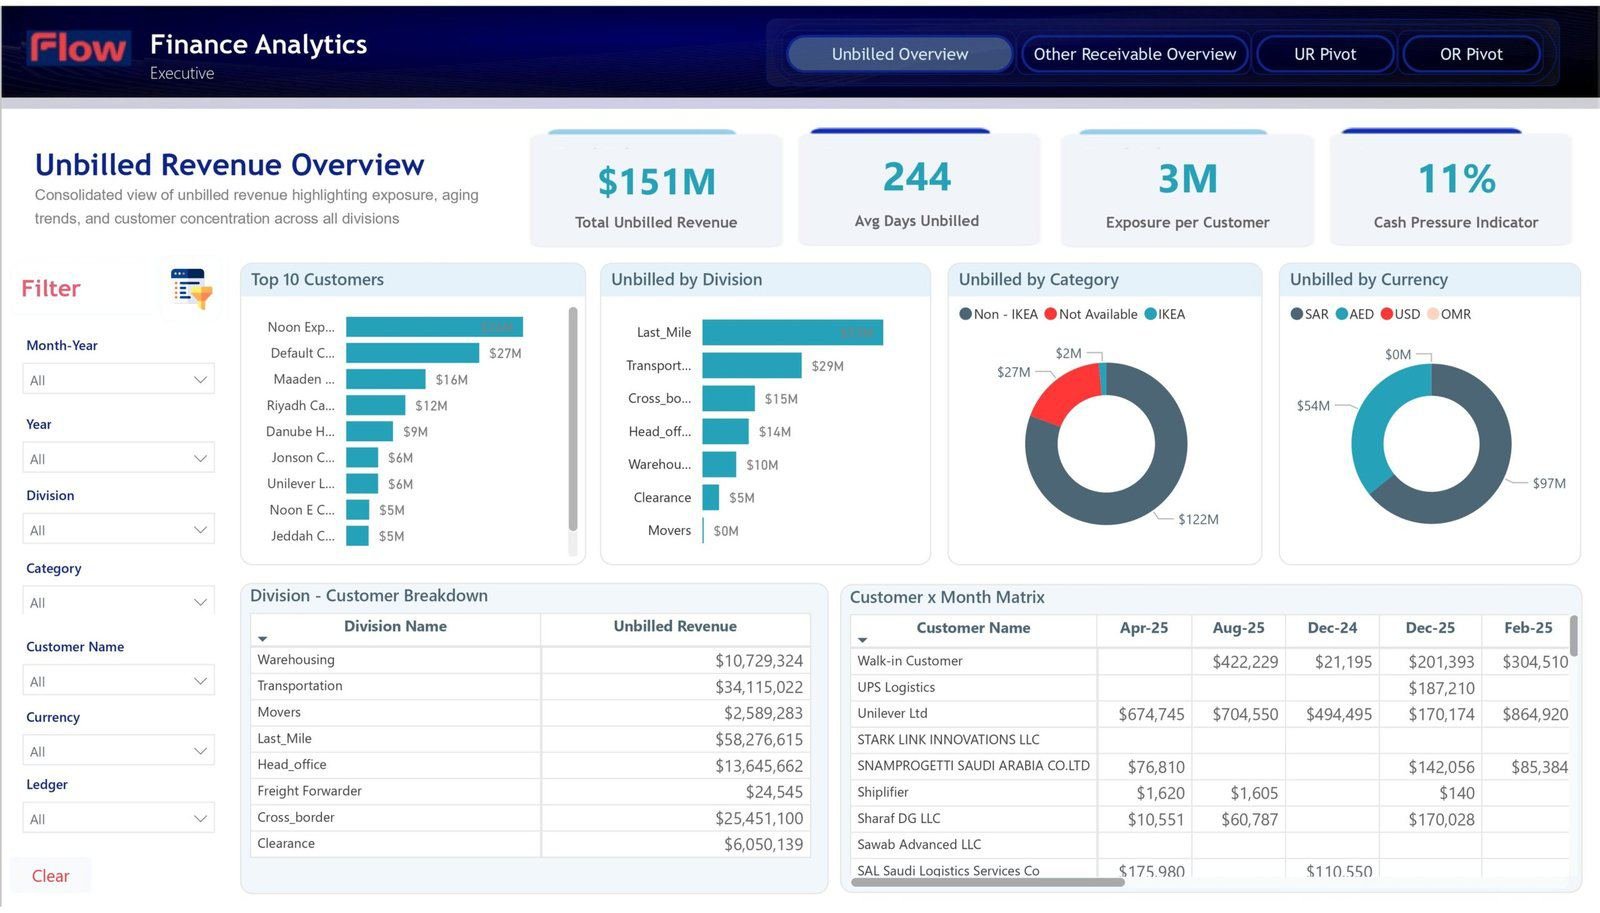
Unbilled Revenue Overview
Built to help management quickly understand the scale, aging and distribution of unbilled revenue across the organisation. High-level KPIs sit alongside supporting visuals: $151M in total unbilled revenue, 244 average days unbilled, $3M exposure per customer, and an 11% cash-pressure indicator — a direct snapshot of billing delays and working-capital pressure. Breakdowns by division, category, currency and top customers, plus a customer-by-month matrix, make it easy to trace where the largest balances sit and how they're distributed operationally.
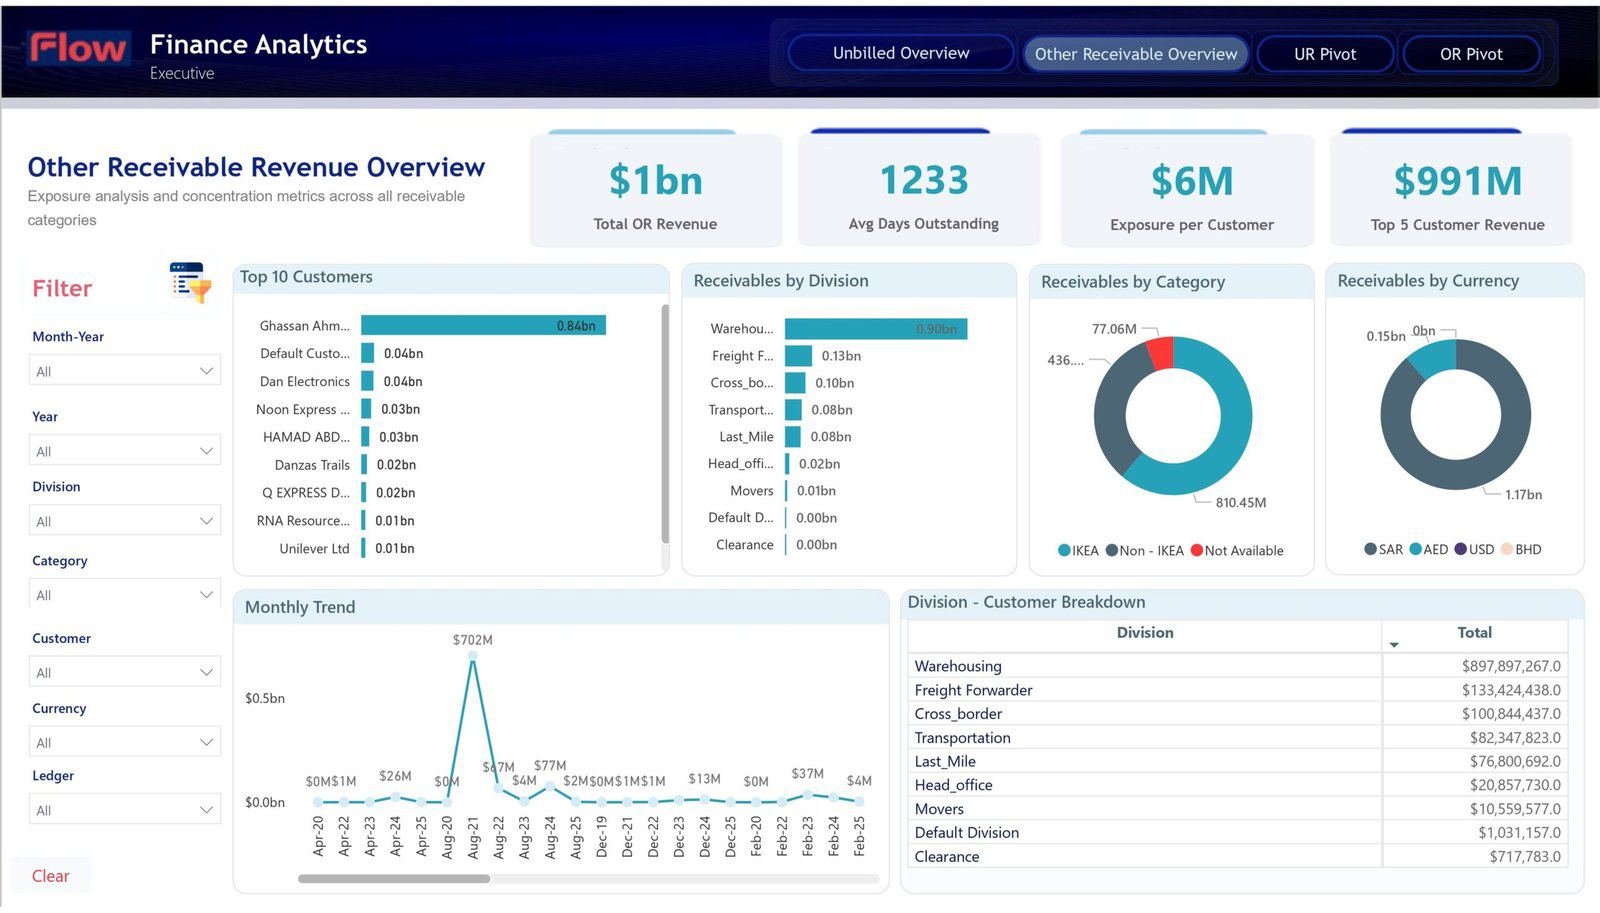
Other Receivable Revenue Overview
Extends the analysis beyond unbilled revenue to broader receivable exposure — concentration, large outstanding balances, and risk spread across business units and customer groups. Key metrics such as $1bn total other receivable revenue, 1,233 average days outstanding, $6M exposure per customer and $991M top-5-customer revenue immediately signal the scale and aging profile of receivables, while supporting visuals by division, category, currency, monthly trend and top-10 customers surface dependency on a small number of accounts.
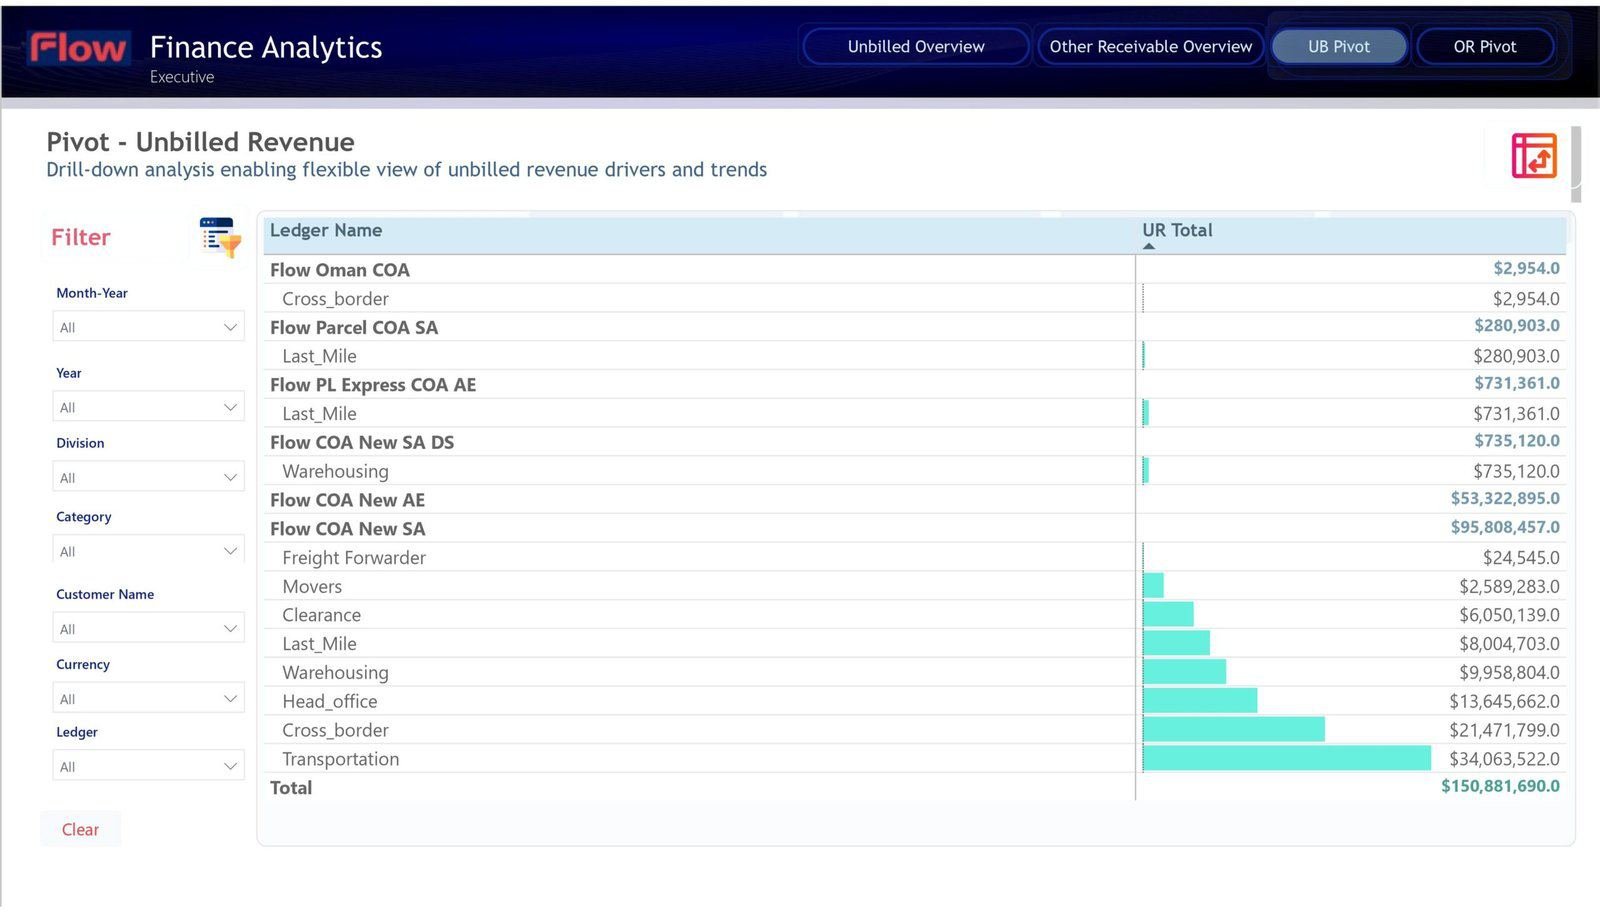
Pivot Analysis for Unbilled Revenue
A drill-down layer for finance teams needing a more detailed, flexible view of the underlying numbers — analysing balances by ledger and division structure to validate figures, trace exposure sources and support internal review discussions. The pivot view rolls up to a total unbilled revenue of $150.9M while preserving detailed drill-down visibility into ledger-level composition.
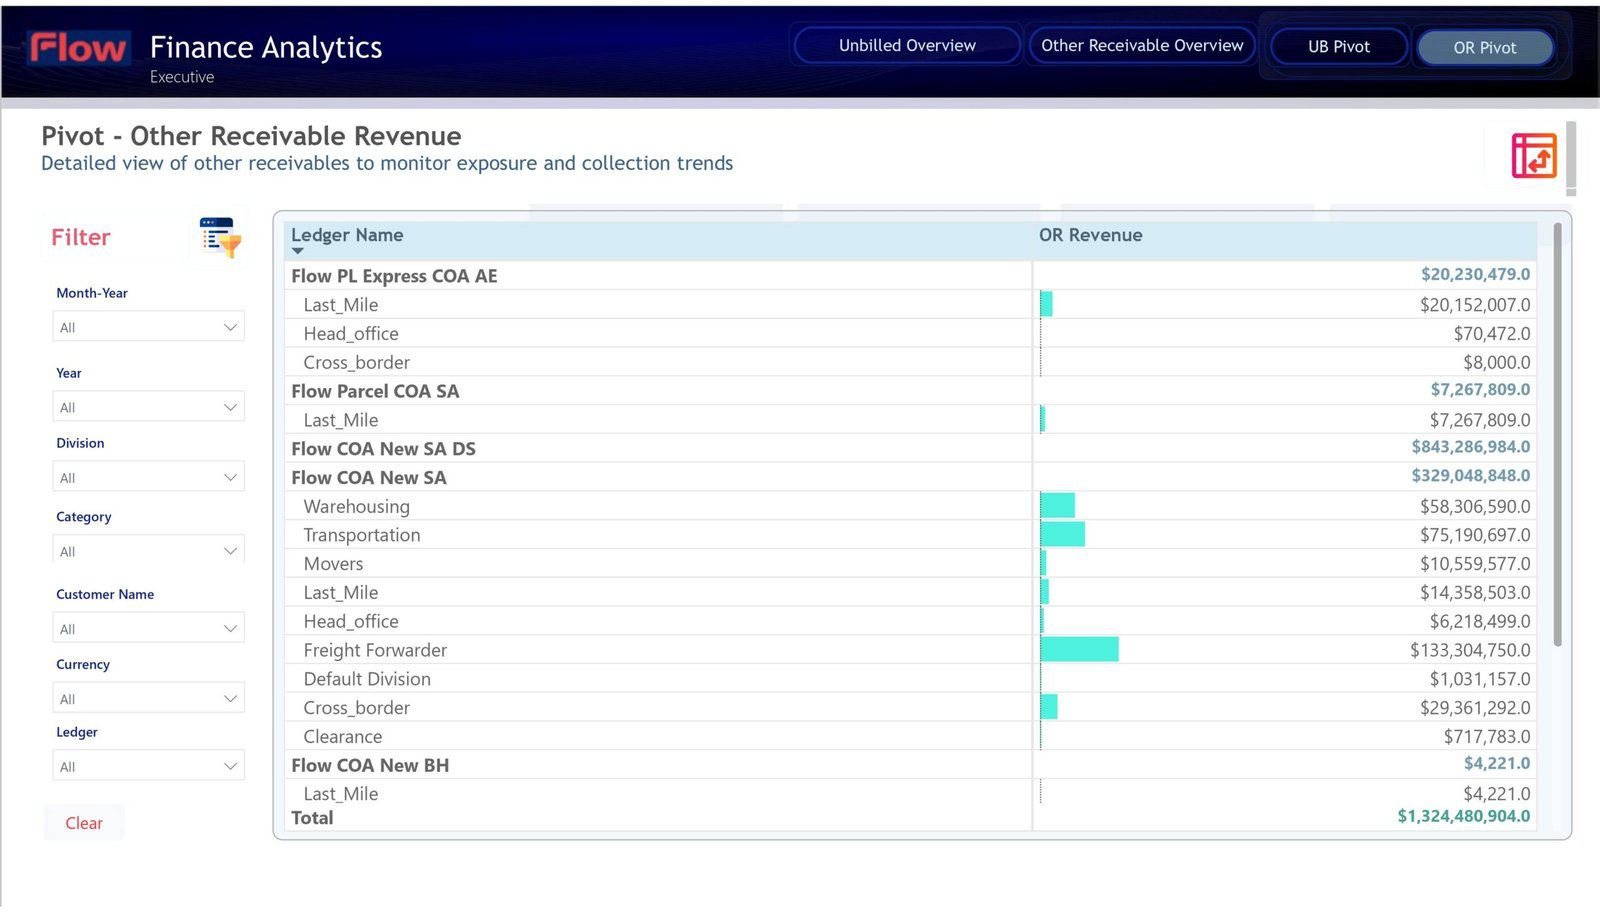
Pivot Analysis for Other Receivable Revenue
The same drill-down capability applied to other receivables — a granular, operational view of outstanding balances by ledger and division that supports exposure monitoring and collection analysis. The pivot rolls up to approximately $1.324bn in other receivable revenue, giving management both scale awareness and the ability to investigate the composition behind that total.