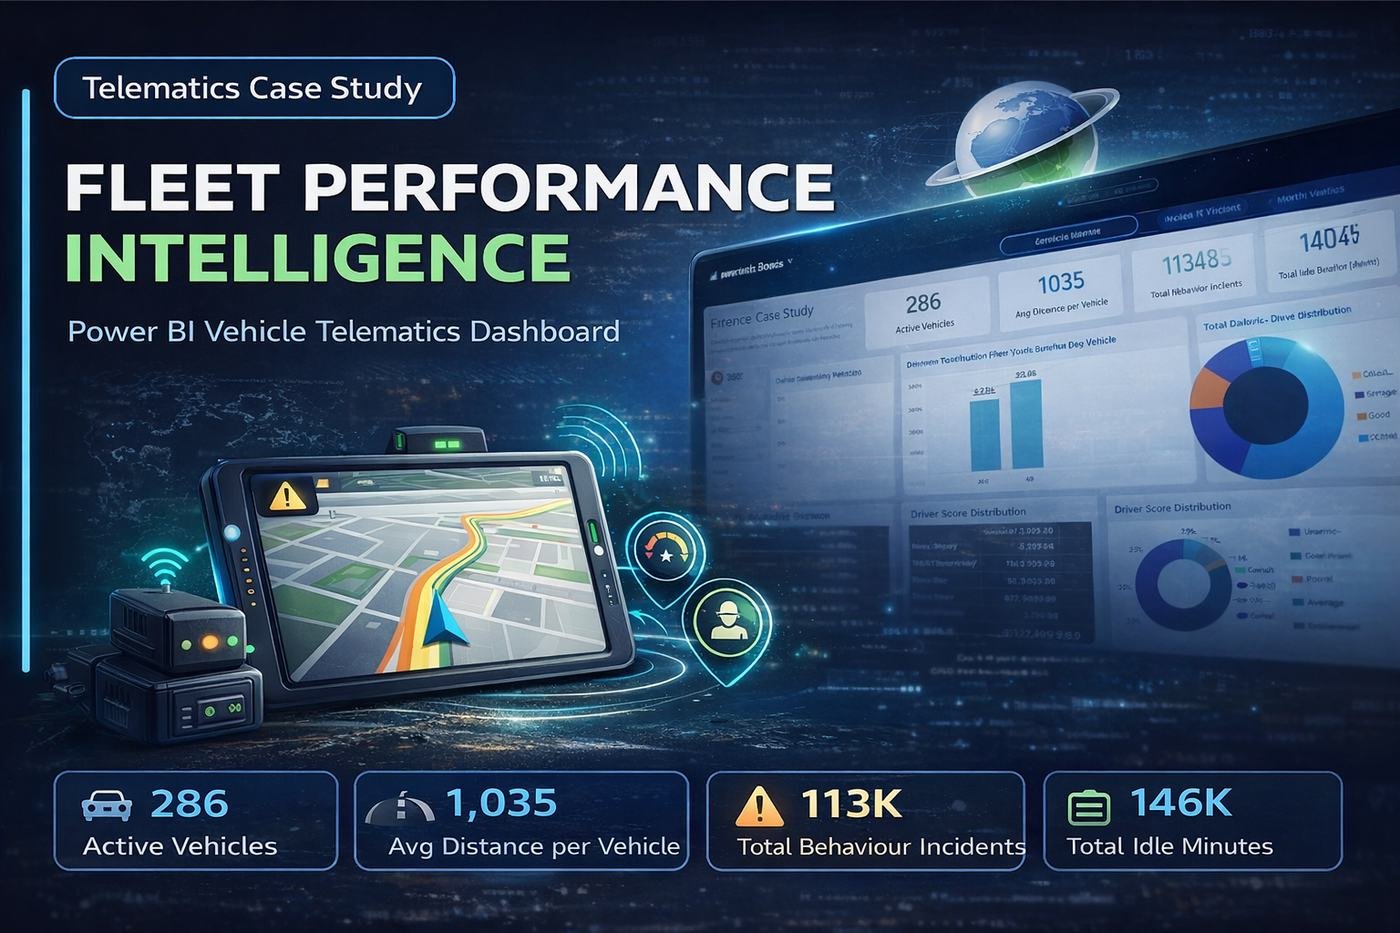
PowerTrack Africa is a fleet management and telematics solutions provider operating in DR Congo. Their business revolves around GPS tracking, fleet visibility, driver behaviour management and analytics-driven decision-making — so the reporting solution had to do more than display raw telematics data. It needed to convert operational movement into actionable business insight.
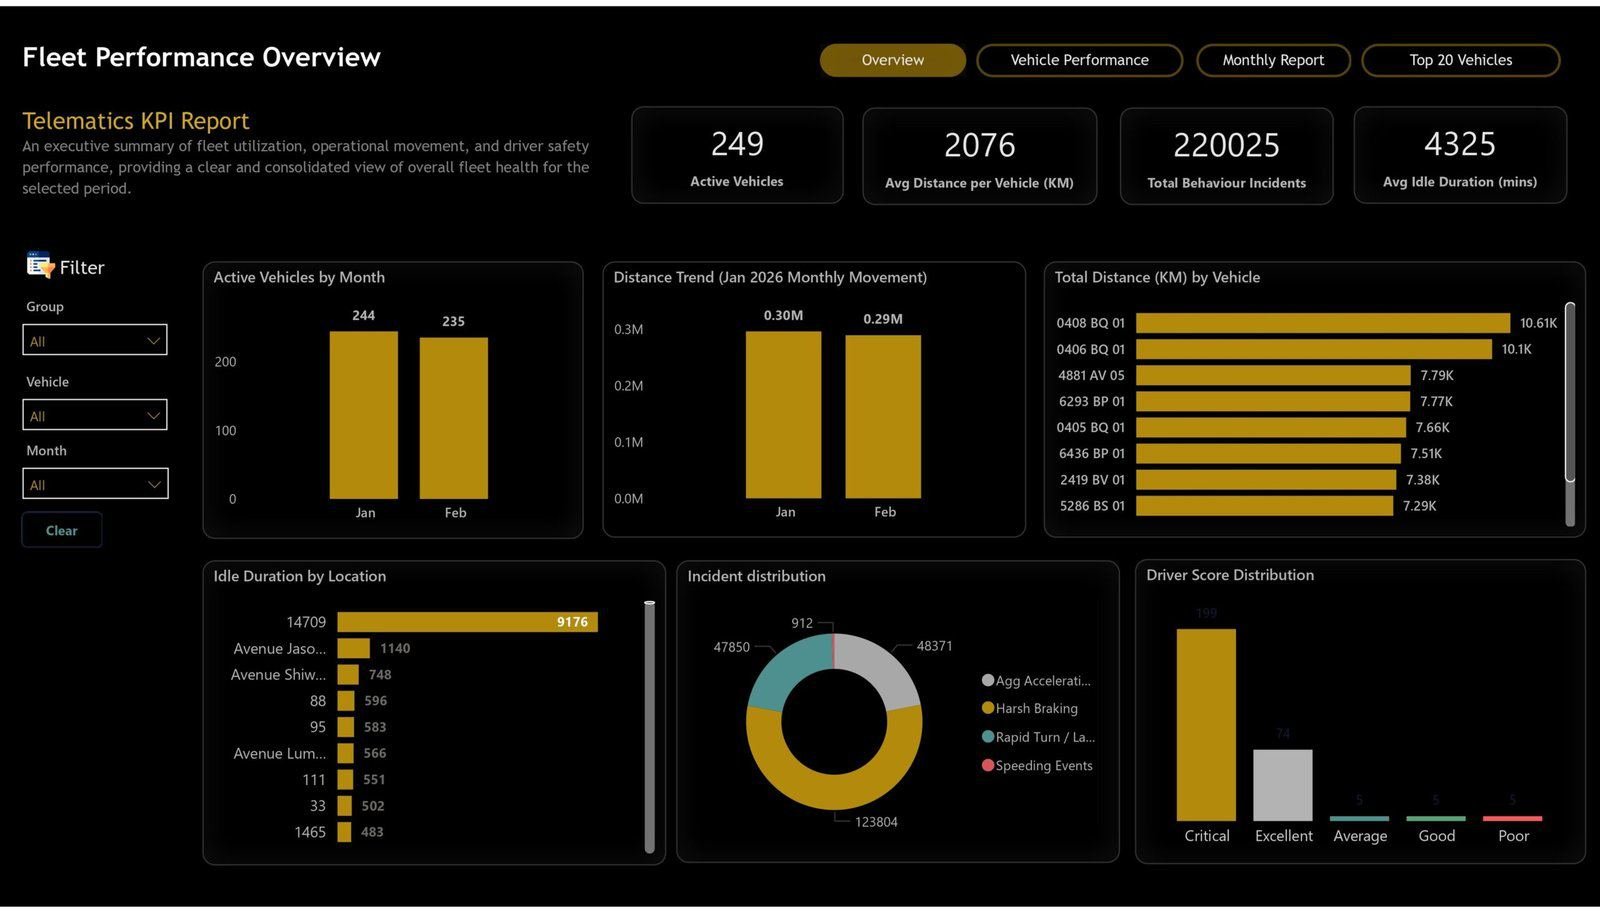
Executive Overview
Built to help management quickly assess overall fleet health through headline KPIs and visual summaries: active vehicles, average distance per vehicle, total behaviour incidents and total idle duration. Supporting visuals for distance trends, top vehicles by distance covered, idle duration by location, incident distribution and driver score distribution make it easy to spot where inefficiencies and safety concerns concentrate. In January 2026 alone, the dashboard summarised 286 active vehicles, 1,035 average distance per vehicle, 113,485 total behaviour incidents and 146,027 total idle minutes — a compact but highly actionable operational snapshot.
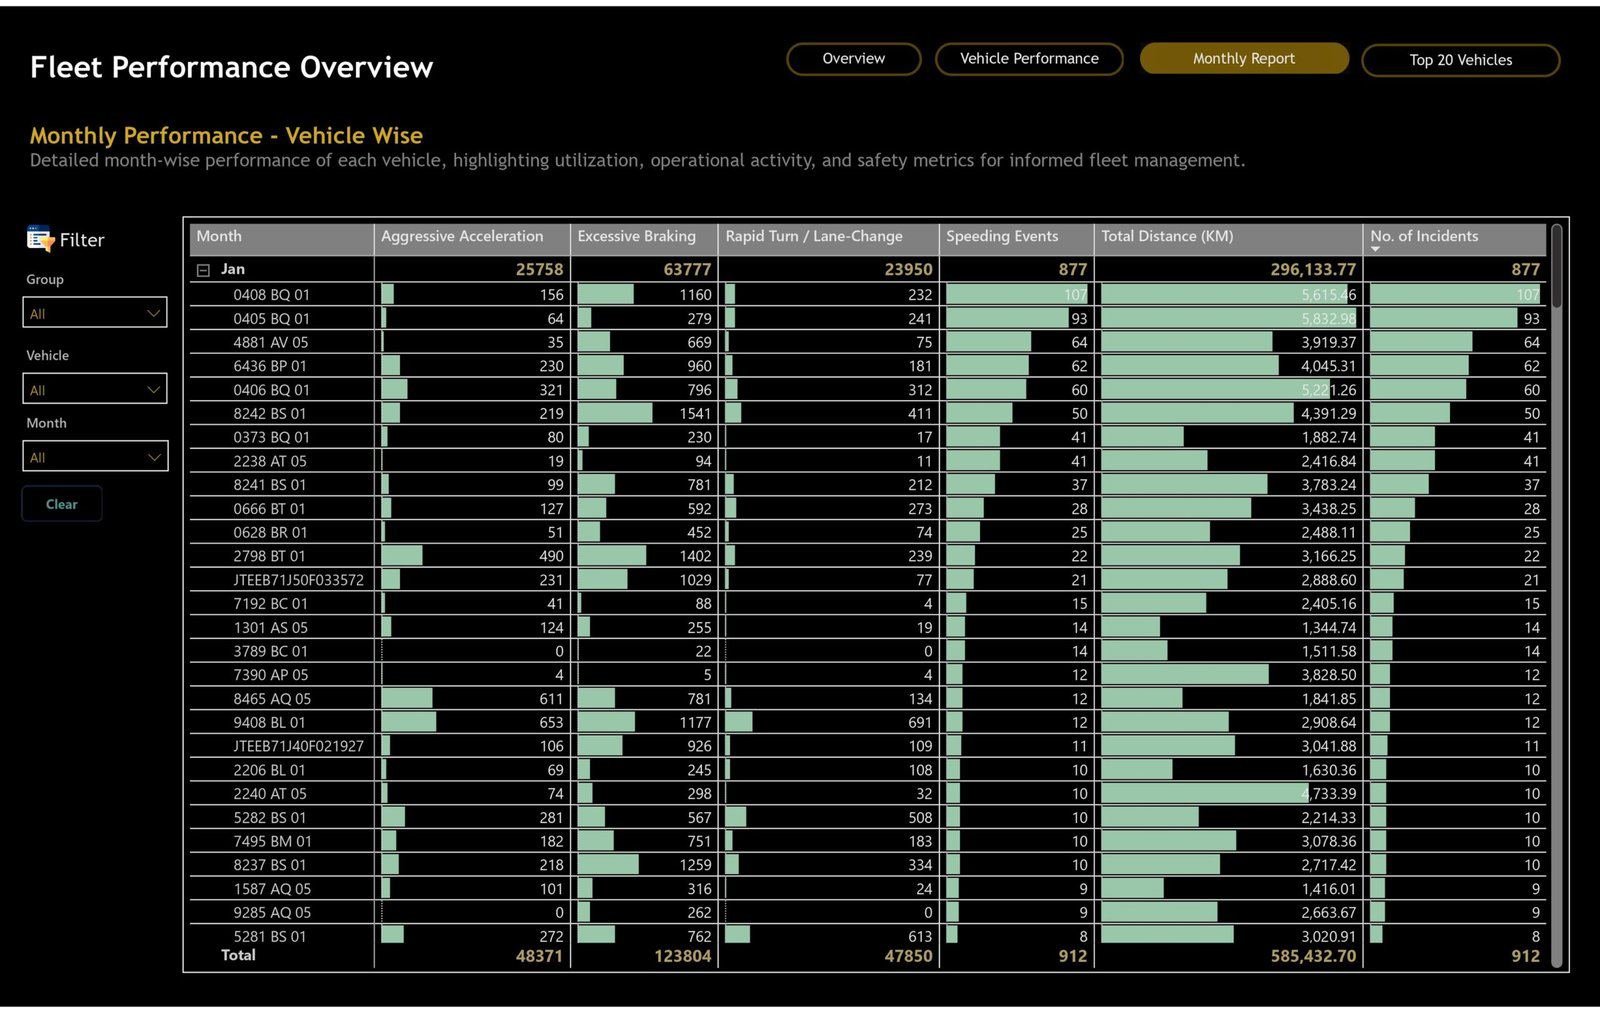
Monthly Report (Vehicle-Wise Performance)
Designed for deeper operational analysis at the individual vehicle level — breaking down each vehicle's monthly performance across aggressive acceleration, excessive braking, rapid turns/lane changes, speeding events, total distance covered and total incidents. This turns the dashboard from a reporting tool into a management tool, helping the client pinpoint exactly which vehicles are driving performance issues within the fleet.
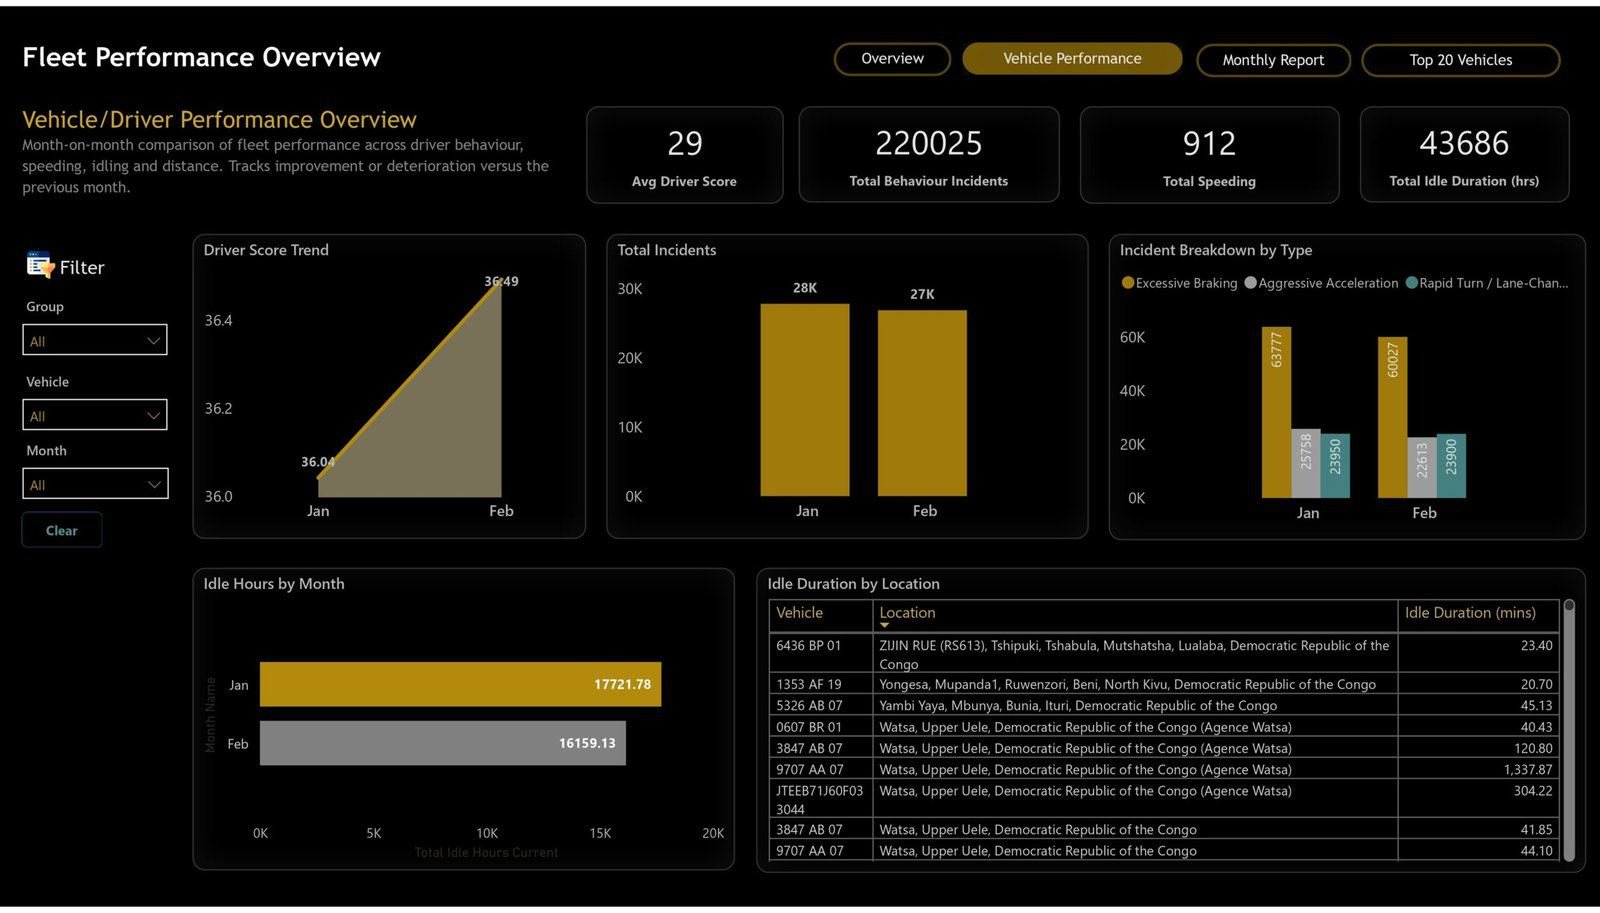
Monthly Vehicle Performance Analysis
A detailed, vehicle-level view of monthly operational and safety performance, with filters for group, vehicle and month adding analytical flexibility. This page helps management quickly identify which vehicles are contributing most to unsafe driving behaviour, which are covering higher operational distance, and where intervention — driver coaching, safety monitoring, operational review — is needed.
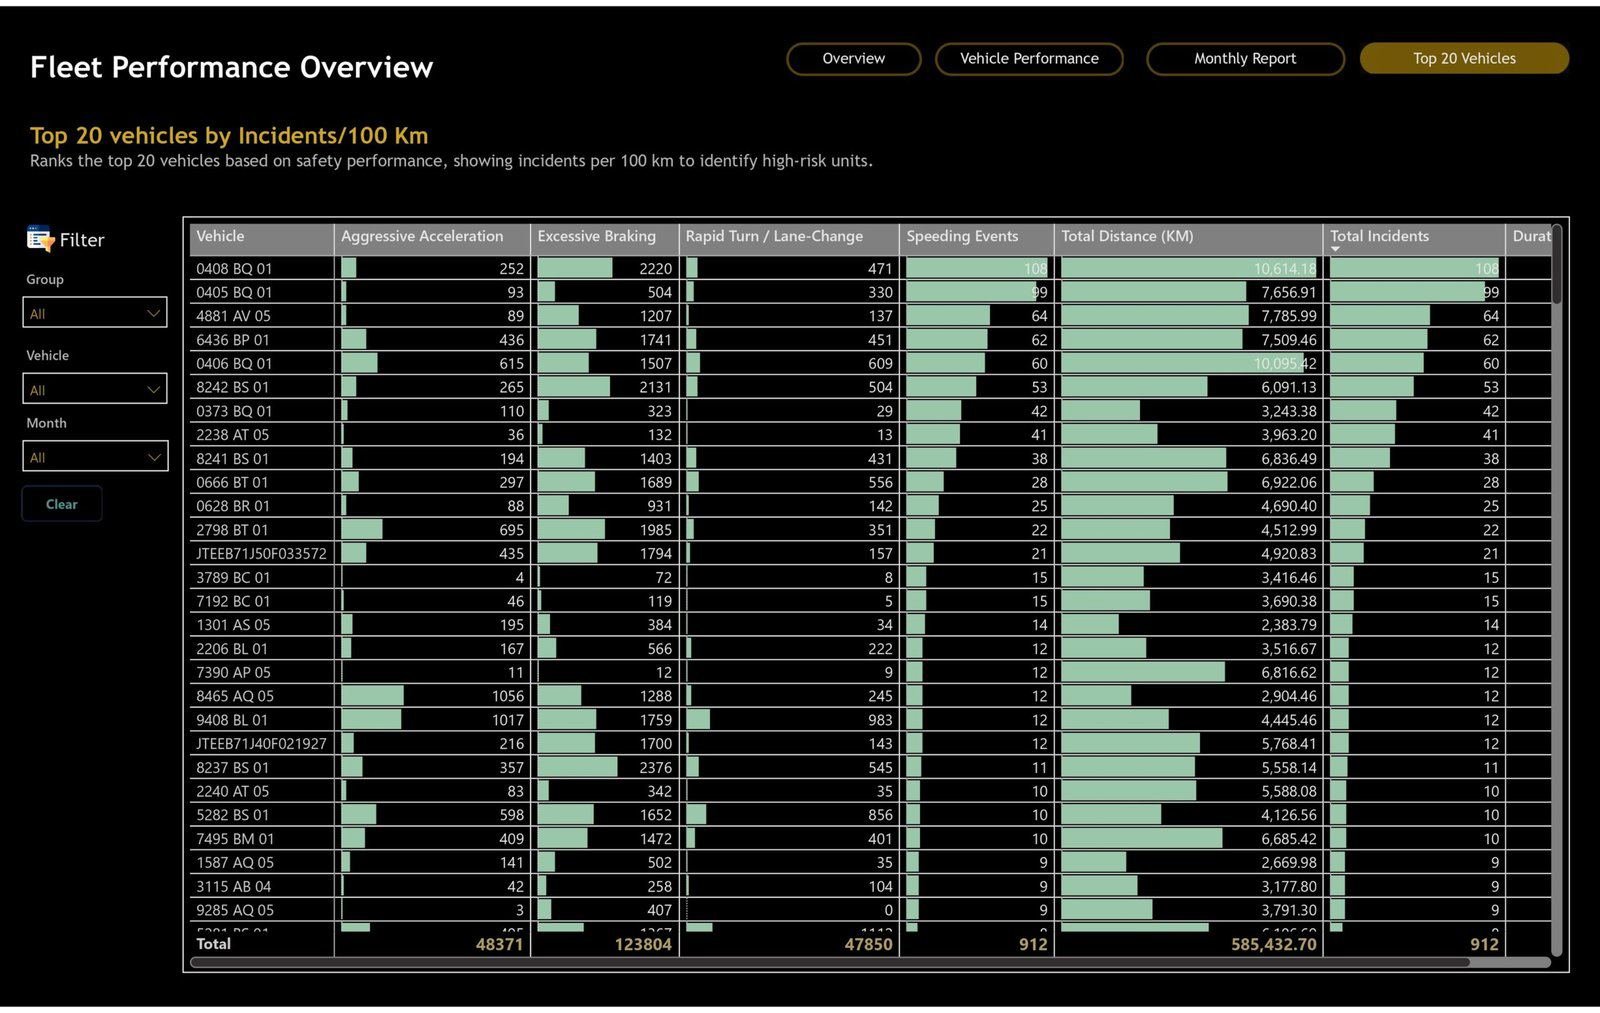
Top 20 Vehicles by Incidents per 100 KM
Ranks the top 20 vehicles by incidents per 100 kilometres — a far more meaningful benchmark than raw incident counts, since high-distance vehicles naturally generate more activity. Combined with the underlying behaviour indicators and distance metrics, this view helps the client quickly isolate genuinely high-risk units and make more informed decisions around driver monitoring, coaching and operational control.