Traffic → Profit: Building a Performance Marketing Dashboard for Vize Homes
This blog presents a Power BI analytics solution built for performance marketing teams, integrating revenue, cost, traffic, and conversion data into a unified dashboarding framework. The report enables data-driven optimization of campaigns, publishers, and advertisers by linking traffic quality directly to financial outcomes.

Client Profile
Name: Vize Homes
Background: USA-based company
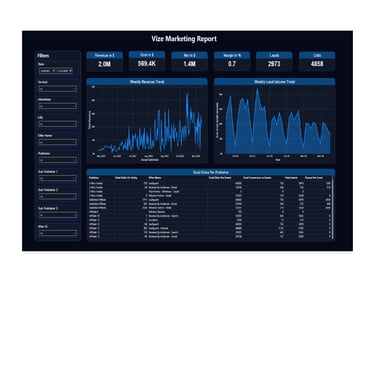
Marketing Performance Overview Dashboard
The Marketing Performance Overview Dashboard provides a high-level snapshot of overall campaign performance by consolidating revenue, cost, net profit, margin, leads, and call volume into a single executive view. It enables leadership and marketing managers to quickly assess profitability and volume trends across selected time periods, publishers, advertisers, and offers. Weekly revenue and lead volume trends highlight campaign volatility and growth patterns, while top-line KPIs such as RPU and CPU help evaluate unit economics. This dashboard acts as the primary health check for the marketing operation, answering whether campaigns are scaling profitably or not
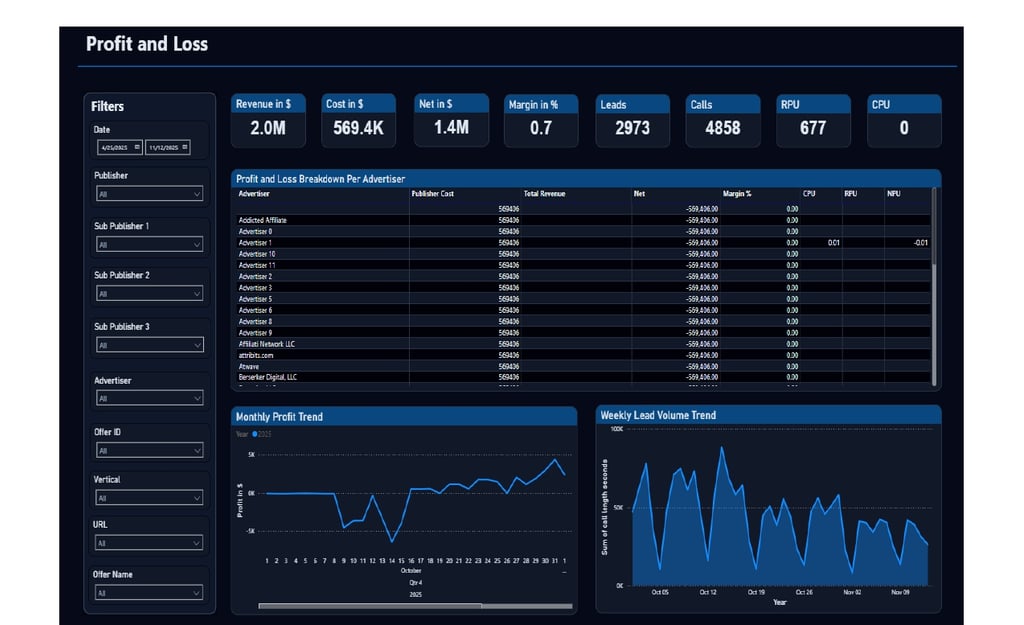

Profit & Loss by Advertiser Dashboard
The Profit & Loss Dashboard focuses on financial performance at an advertiser and campaign level, offering granular visibility into revenue, cost, net profit, and margin contribution. It breaks down profitability per advertiser, allowing teams to identify underperforming partners and high-margin opportunities. Monthly profit trends provide insight into earnings consistency, while detailed tables support deep-dive analysis into conversion efficiency, cost structures, and revenue attribution. This dashboard is critical for performance marketing teams aiming to optimize budgets, renegotiate partnerships, and improve overall ROI

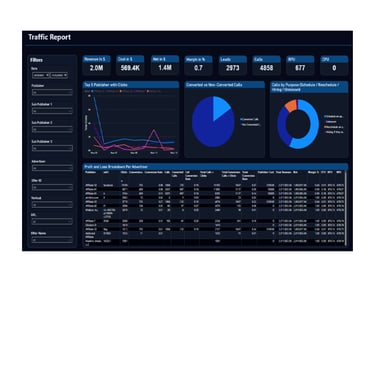
Traffic & Conversion Analytics Dashboard
The Traffic Dashboard analyzes the quality and effectiveness of incoming traffic by linking clicks, calls, conversions, and call outcomes. It highlights top publishers by click volume, conversion performance, and revenue contribution, helping teams distinguish between high-volume and high-quality traffic sources. Visuals such as converted vs non-converted calls and call purpose distribution (scheduled, rescheduled, hiring, unknown) provide operational insight into lead intent and call handling effectiveness. By connecting traffic behavior with financial outcomes, this dashboard enables data-driven optimization of traffic sources, publisher strategies, and conversion funnels
Location
Karachi, Pakistan
Contacts
+92 336-2349646
ammarullahkhan5@gmail.com
Expertise
Transforming data into impactful stories for my clients