Calls → Cases: Building a Call Center & SLA Dashboard for Europ Assistance
This blog showcases a Power BI analytics solution built for service operations and call center performance monitoring. The report integrates telephony metrics, SLA tracking, and case management insights into a unified dashboarding framework, enabling data-driven decisions across operations, quality, and service leadership teams.
DATA ANALYTICS
Client Profile
Name: Europ Assistance
Location: Germany
Doamin: Europ Assistance operates a multi-line, multi-channel business model centered on providing a wide range of assistance and insurance services globally through a hybrid B2B, B2C, and B2B2C distribution strategy. Their mission is to move people "from distress to relief" anytime, anywhere
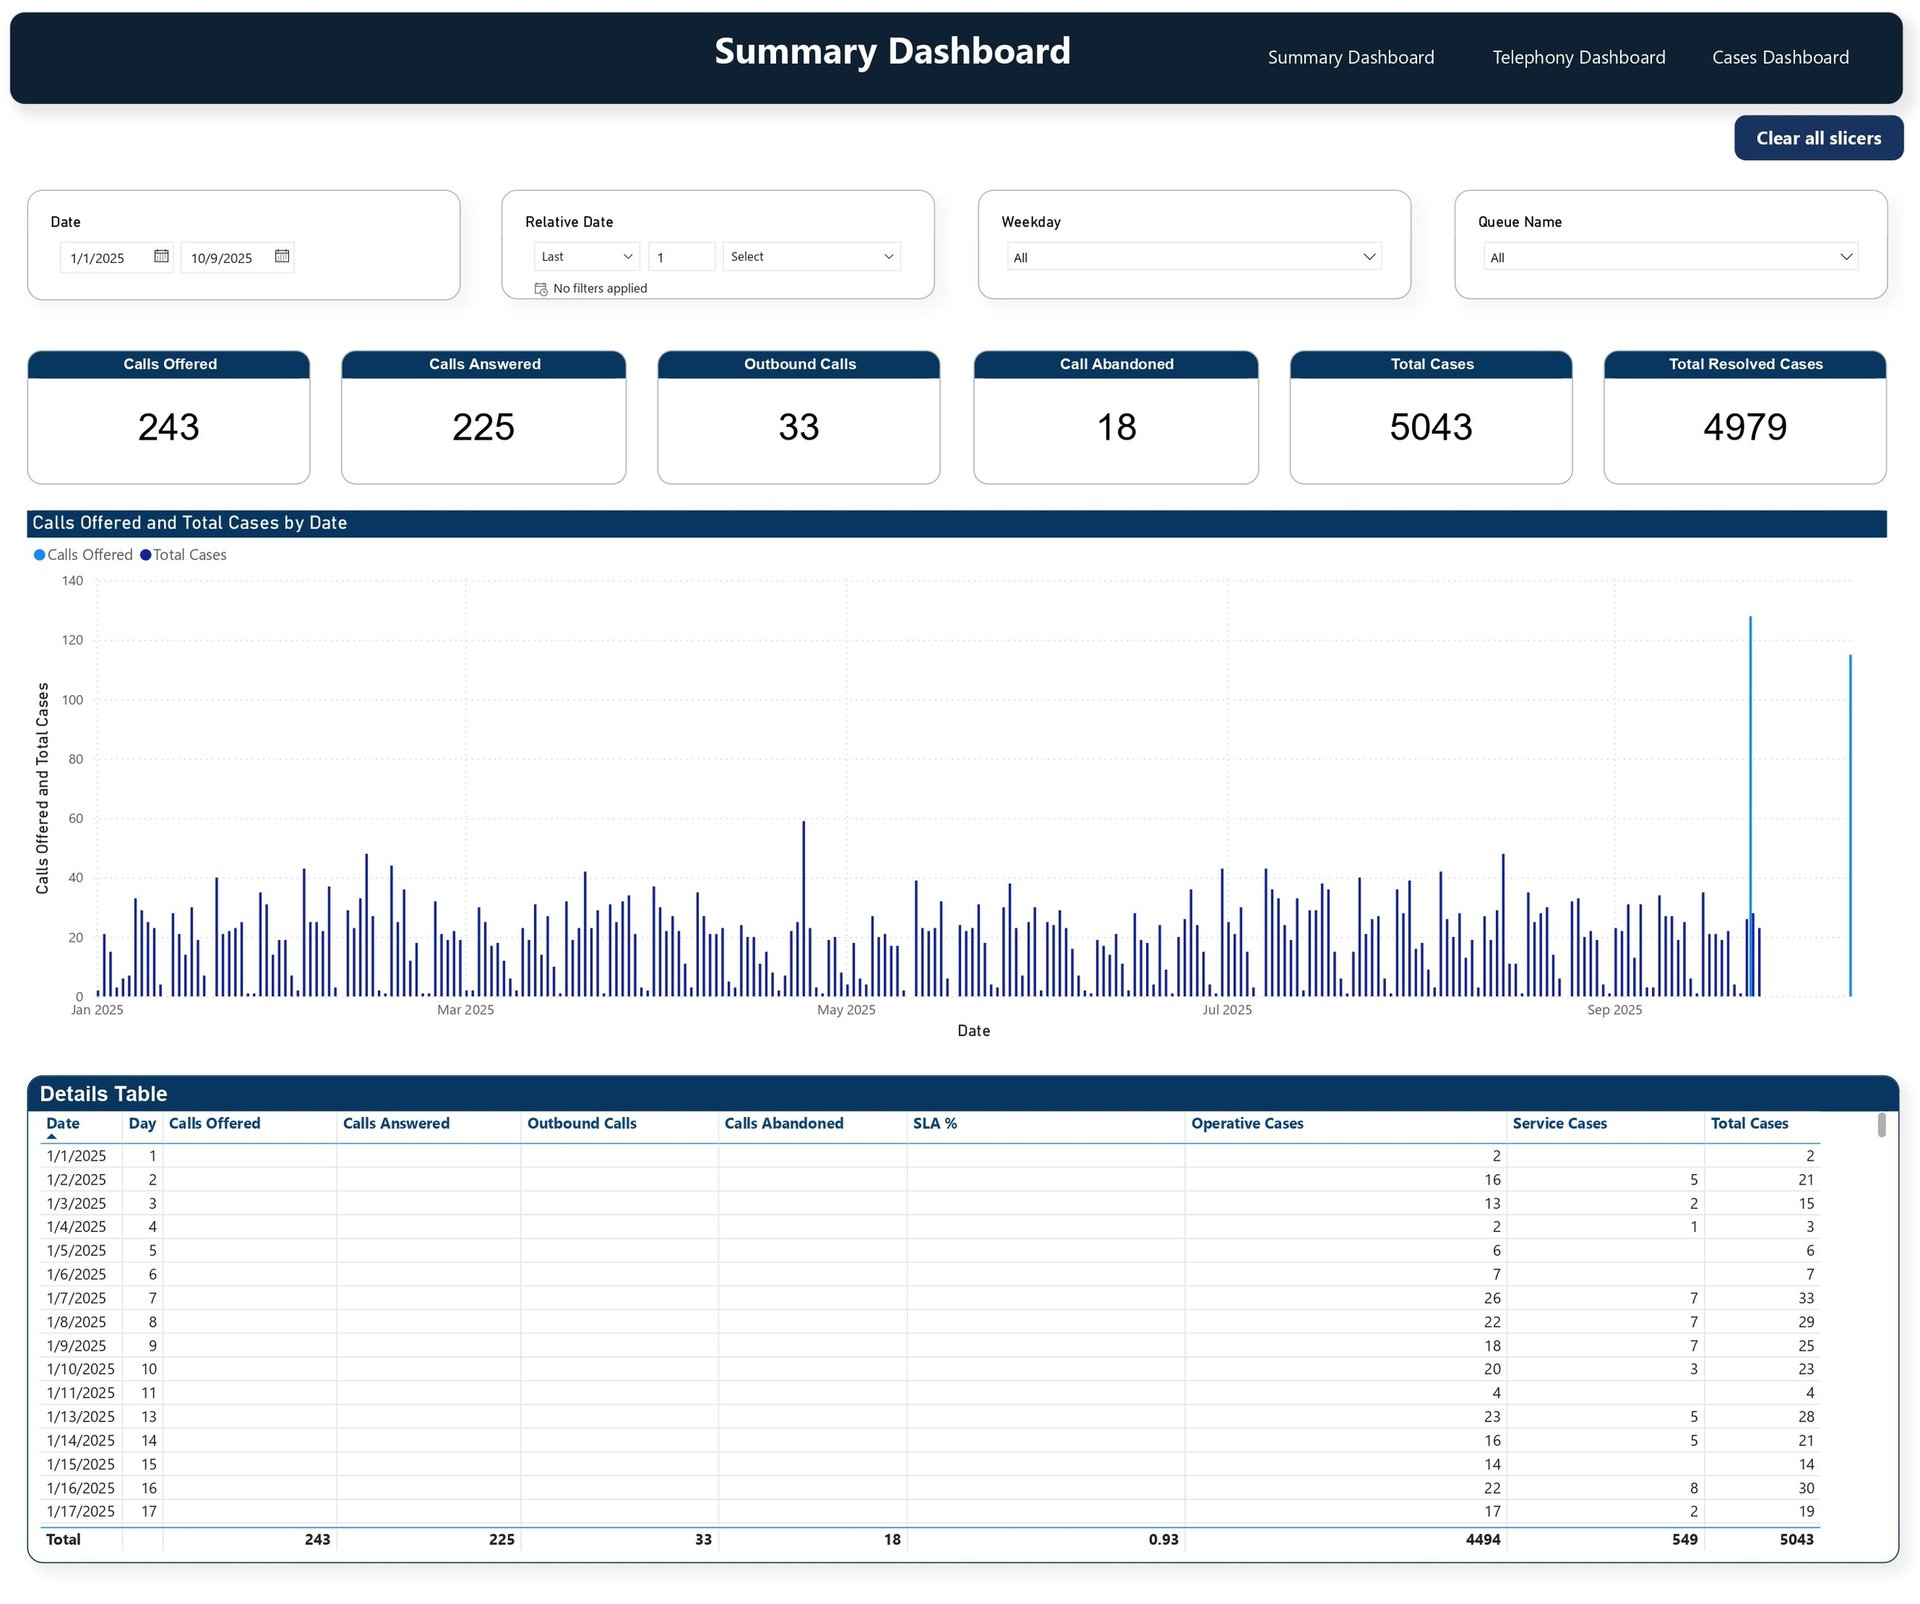
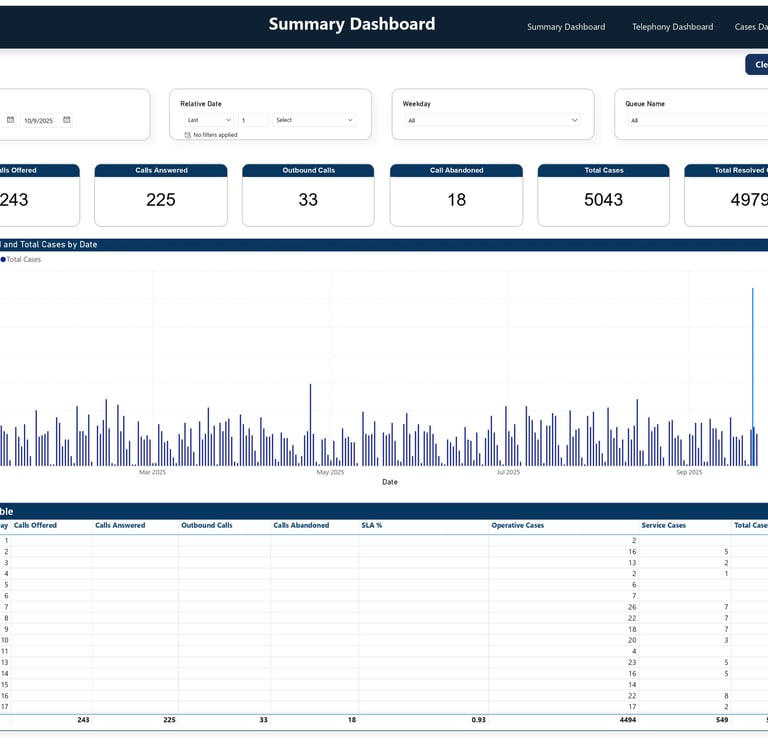
Service Operations Summary Dashboard
The Summary Dashboard provides a consolidated, executive-level view of overall service and call center performance. It captures key operational KPIs such as total calls offered, calls answered, abandoned calls, outbound calls, total cases, and resolved cases, enabling leadership to quickly assess service load and resolution efficiency. Time-based trend analysis highlights fluctuations in call volume and case creation over time, while detailed tables support validation at a daily granularity. This dashboard acts as the primary control panel for senior stakeholders, answering the critical question of how effectively the service operation is handling incoming demand across queues and time periods
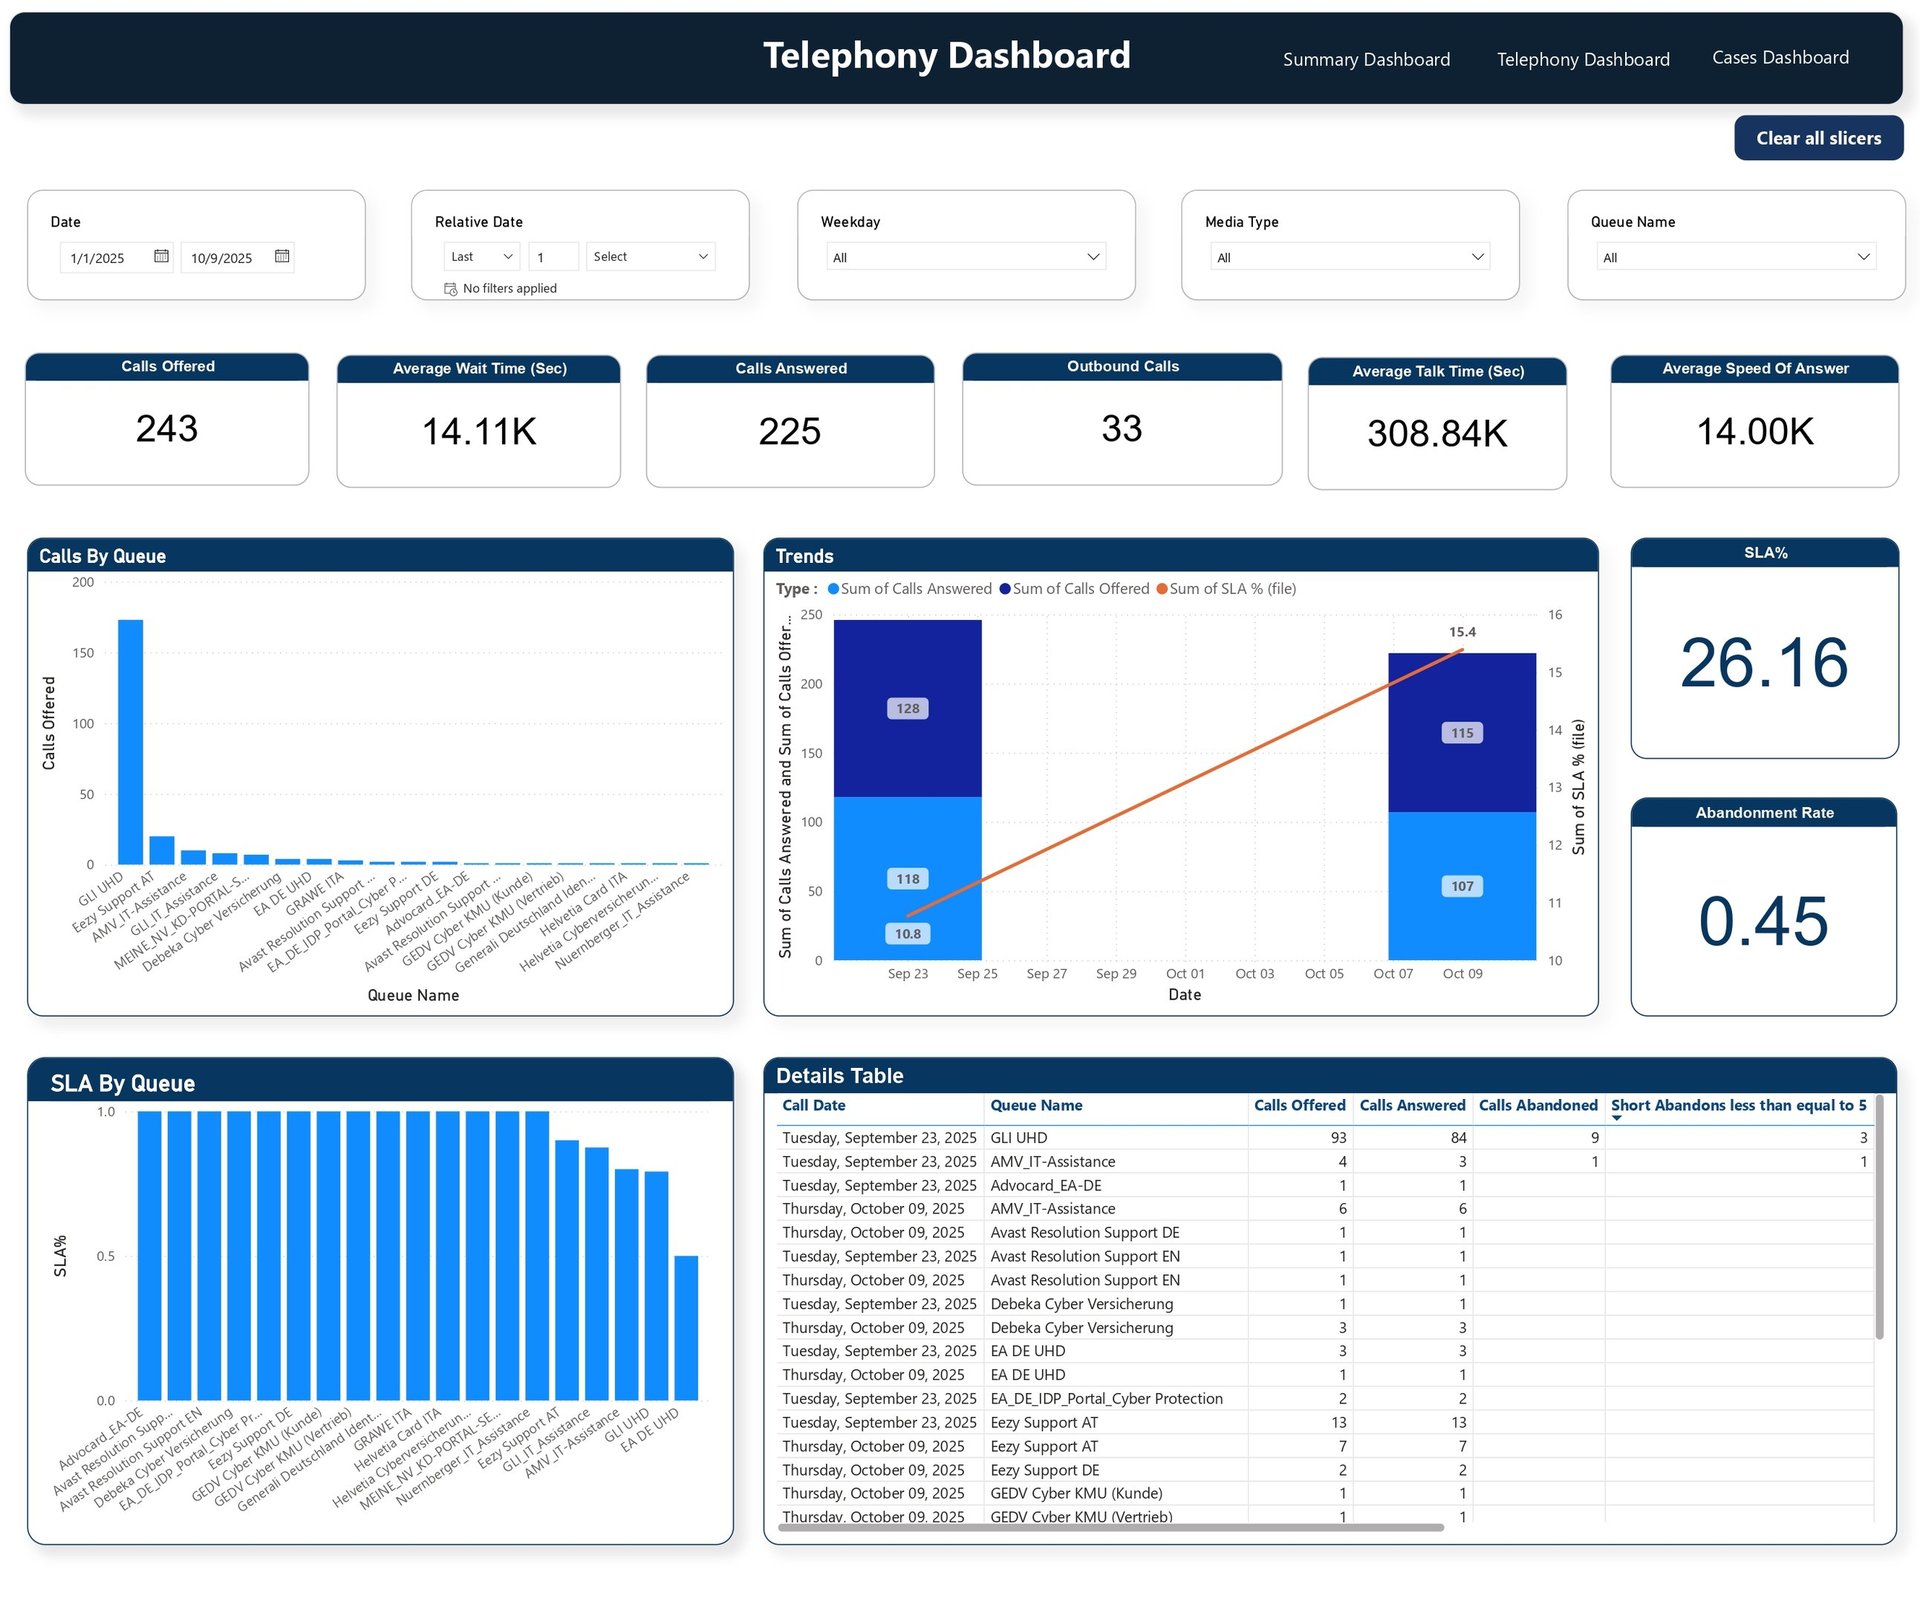
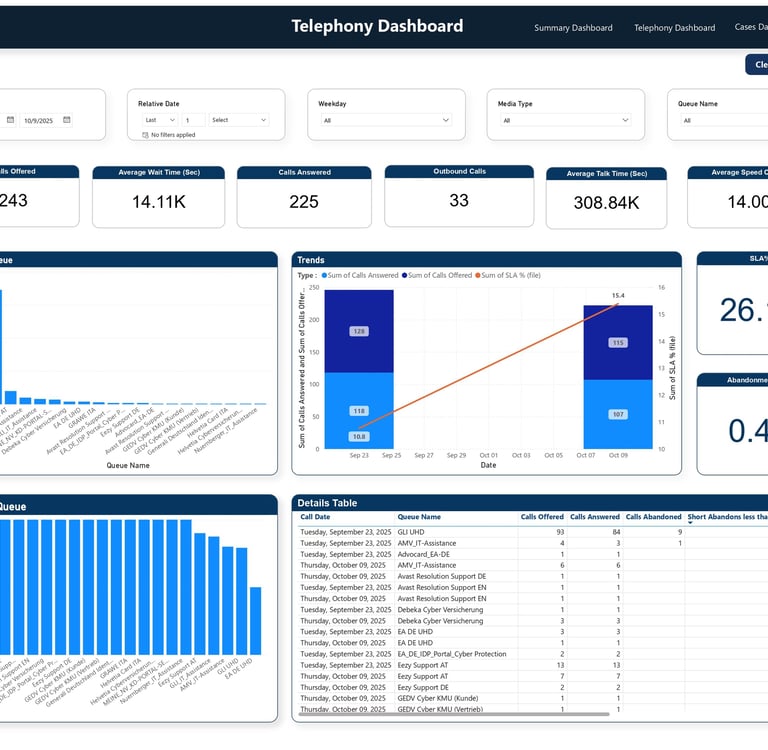
Telephony Performance & SLA Dashboard
The Telephony Dashboard focuses on call-handling efficiency and service quality across multiple support queues. It provides deep visibility into average wait time, average speed of answer, average talk time, SLA performance, and abandonment rates. Queue-level breakdowns highlight which support lines receive the highest call volumes and where SLA performance may be under pressure. Trend visuals enable operations managers to identify peak periods and performance degradation over time, making this dashboard essential for workforce planning, queue optimization, and SLA compliance in a high-volume contact center environment
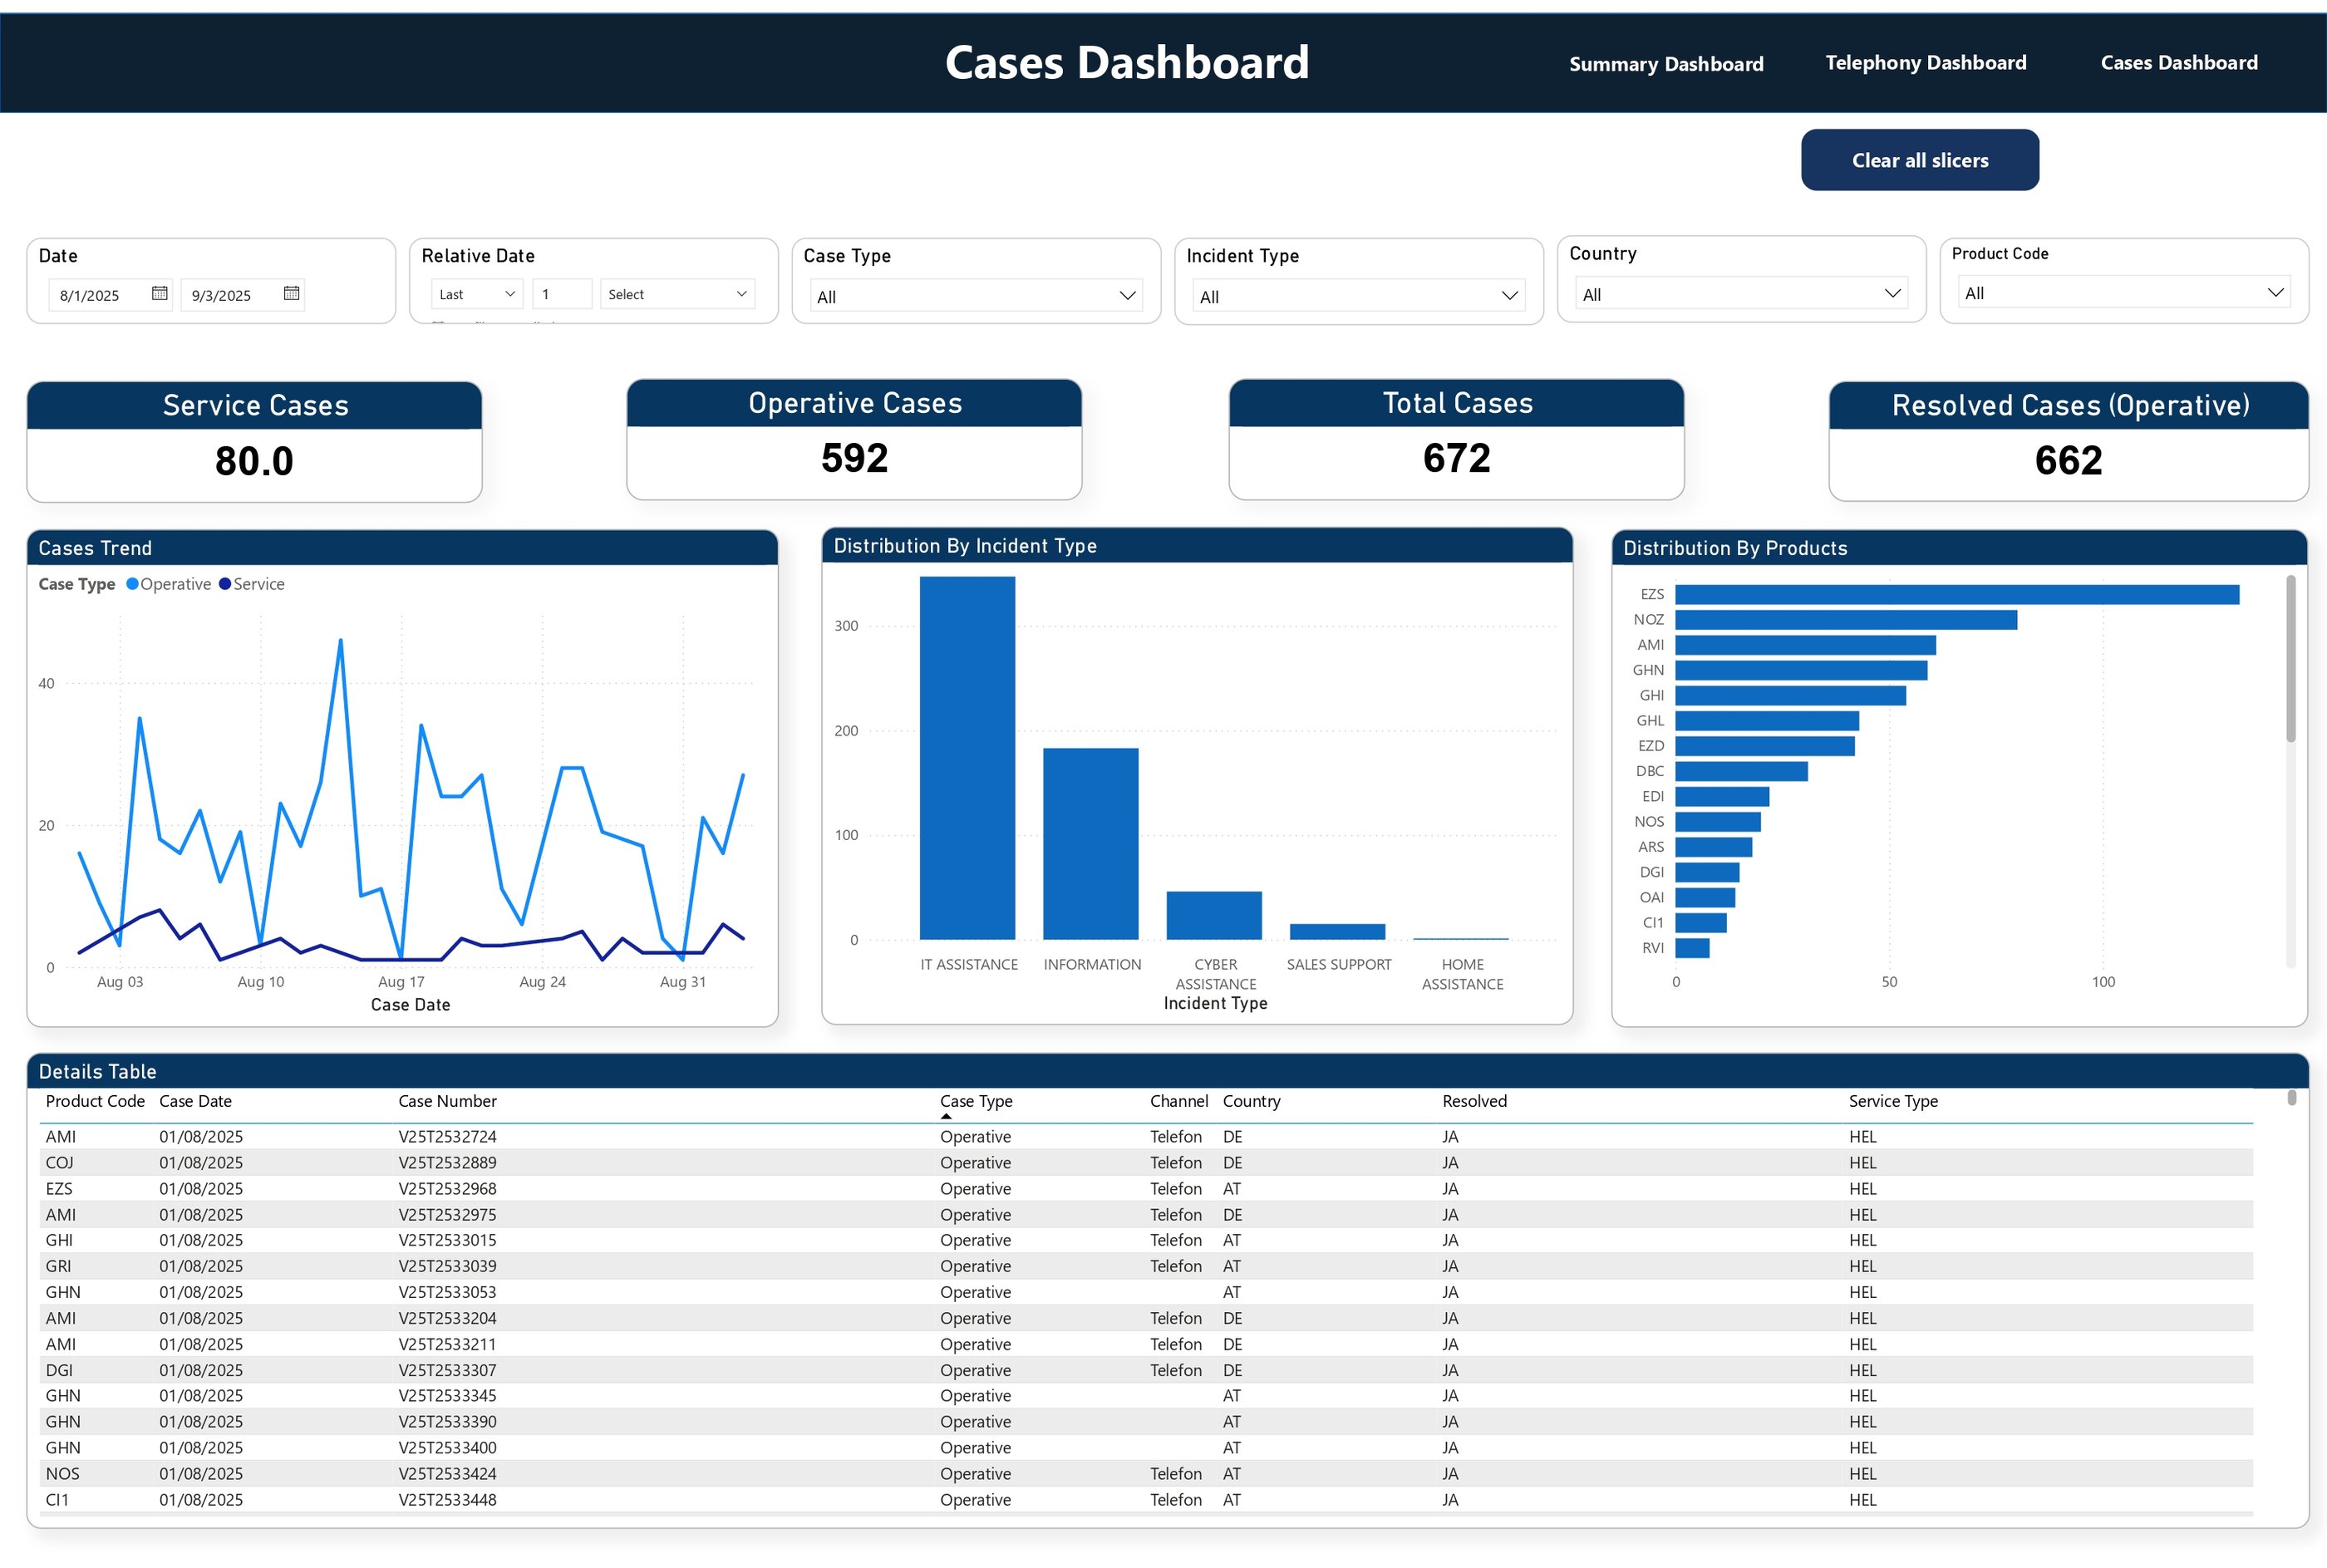
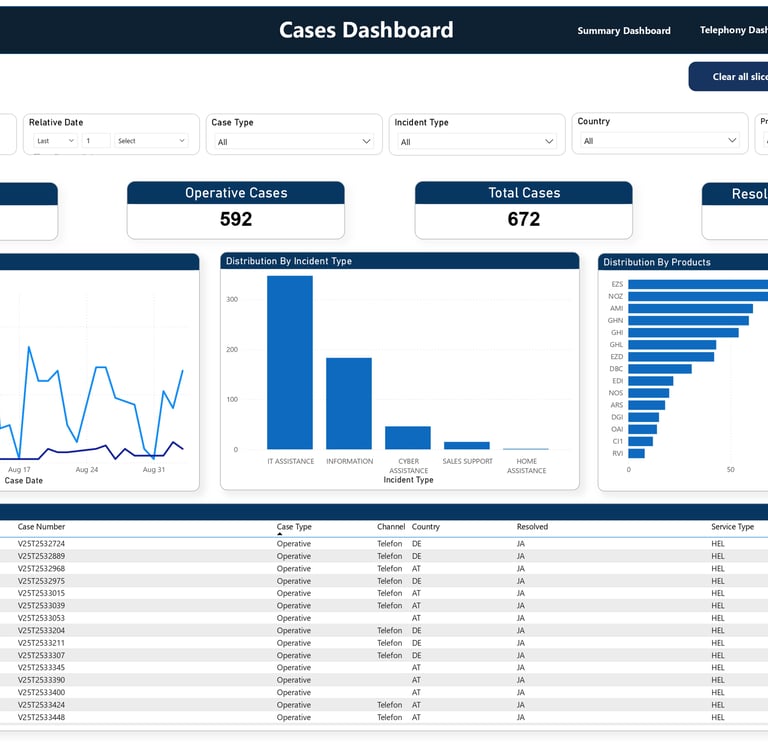
Case Management & Resolution Dashboard
The Cases Dashboard delivers detailed insights into case lifecycle management, focusing on operative and service cases across products, incident types, countries, and channels. It tracks total cases, resolved cases, and case distribution by incident type and product, allowing teams to identify recurring issues and high-impact service categories. Case trend analysis highlights workload patterns over time, while detailed tables provide full traceability at the individual case level. This dashboard supports data-driven decision-making for service improvement initiatives, root-cause analysis, and operational optimization within Europ Assistance’s service delivery model
Location
Karachi, Pakistan
Contacts
+92 336-2349646
ammarullahkhan5@gmail.com
Expertise
Transforming data into impactful stories for my clients