Appointments → Revenue: Building a Clinic Analytics Dashboard for PatientIQ
This blog presents a Power BI analytics solution designed for healthcare clinics, integrating appointment management, practitioner performance, patient behavior, and lead conversion tracking. The dashboards provide end-to-end visibility into clinic operations, enabling data-driven decisions that improve revenue performance, patient retention, and operational efficiency.
DATA ANALYTICS
Client Profile
Name: PatientQ
Background: USA-based client
Domain: PatientIQ provides a cloud-based software platform that integrates with Electronic Health Records (EHR) systems to help health systems, specialty practices, and medical device companies systematically collect, manage, and analyze patient-reported outcomes (PROs) data.
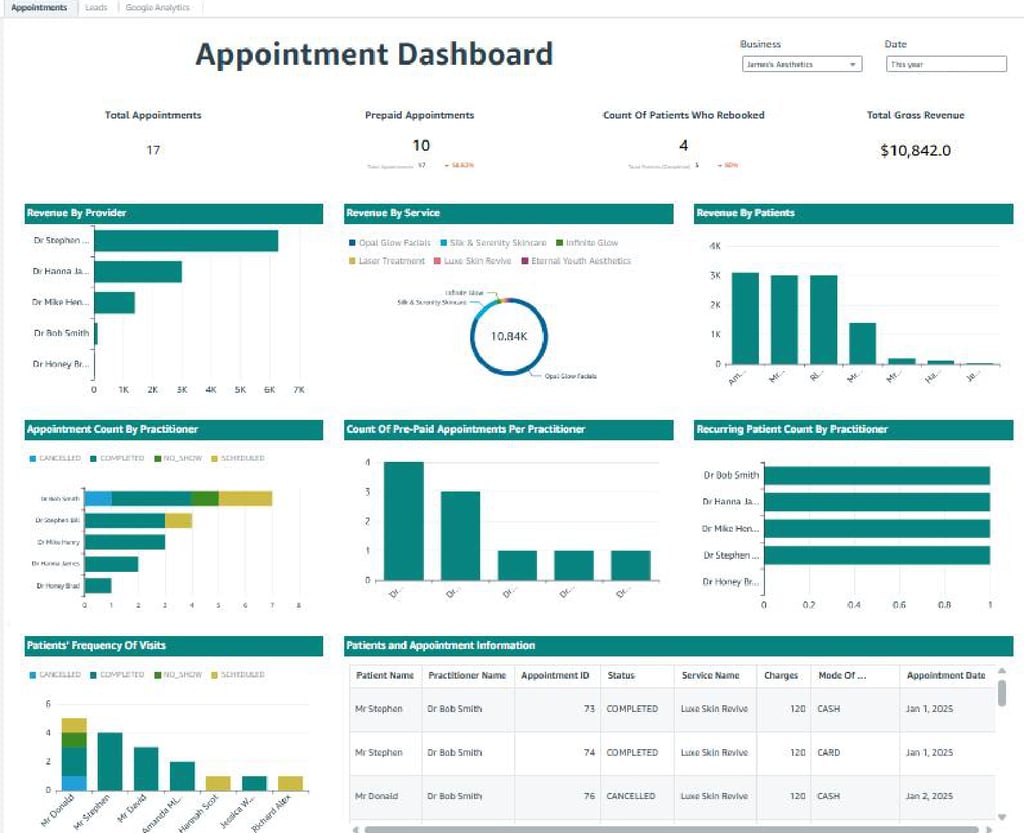
Appointments & Revenue Performance Dashboard
The Appointments Dashboard provides a comprehensive view of clinic operations by combining appointment volume, revenue performance, and practitioner efficiency into a single analytical layer. It tracks total appointments, prepaid appointments, rebooked patients, and total gross revenue, enabling clinic owners to monitor both operational flow and financial outcomes. Revenue breakdowns by provider, service, and patient highlight top-performing practitioners and high-value treatments, while appointment status analysis (completed, cancelled, no-show, scheduled) reveals operational leakage points. This dashboard is critical for understanding how appointment management directly impacts revenue generation and resource utilization within a healthcare practice
This dashboard focuses on practitioner performance and patient engagement patterns. It analyzes appointment counts per practitioner, prepaid appointment distribution, recurring patient visits, and patient visit frequency to identify loyalty trends and repeat business drivers. By surfacing which practitioners generate recurring patients and prepaid bookings, the dashboard supports data-driven decisions around scheduling, incentive structures, and capacity planning. It also helps clinic management understand patient retention behavior, making it a key component for improving long-term revenue stability and patient satisfaction

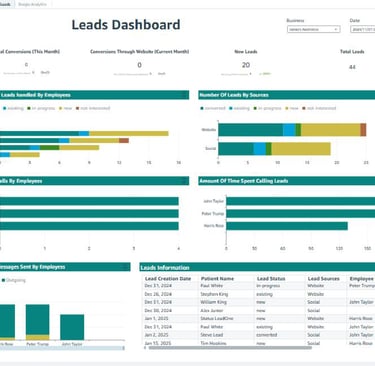
Leads & Conversion Operations Dashboard
The Leads Dashboard delivers end-to-end visibility into lead acquisition, handling, and conversion performance. It tracks total leads, new leads, conversions, and lead sources (website, social, etc.), providing clarity on marketing effectiveness. Employee-level analysis shows how leads are handled across statuses (new, in progress, converted, not interested), supported by call volume, call duration, and messaging activity. This dashboard enables clinic managers to evaluate sales and front-desk efficiency, identify conversion bottlenecks, and optimize lead follow-up processes to maximize appointment bookings and revenue
Location
Karachi, Pakistan
Contacts
+92 336-2349646
ammarullahkhan5@gmail.com
Expertise
Transforming data into impactful stories for my clients